Vernier Graphical Analysis 4.2

Free Analyzes graphics data, collects data from Vernier sensors
1 
Rating
Your vote:
Latest version:
5.18.0 See all
Screenshots
1 / 1
Awards (1)
Show all awards
Software Informer Virus Free award
Download
Free   62.9 MB

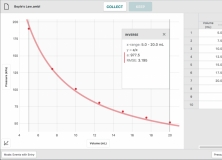
Graphical Analysis™ is a tool for science students to collect, graph and analyze data from Vernier sensors and LabQuest® interfaces. Graphical Analysis™ offers direct data collection from over 50 sensors using Vernier LabQuest, LabQuest 2, LabQuest Mini, (new) LabQuest Stream, and Vernier Go!Link® USB interfaces/

Comments

5 stars
0
4 stars
0
3 stars
0
2 stars
0
1 stars
4
User

Your vote:

Related software

MINITAB
MINITAB
rating

Statistical program designed for data analysis.

Grapher
Grapher
rating

Present your data in 2D/3D graphs and perform statistical analysis.

Graphical Analysis
Graphical Analysis
Free
rating

Collect, share, and analyze Vernier LabQuest sensor data.

ConvertLIT Graphical User Interface
ConvertLIT Graphical User
Free
rating

ConvertLIT GUI is a graphical user interface for command-line tool ConvertLIT.

RJS Graph
RJS Graph
Free
rating

RJS Graph produces professional scientific and mathematical graphs.

Tags

Graph annotations STEM education Calculated columns Display graphs Data tables Data collection