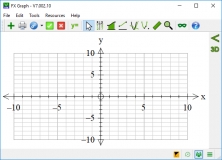
Present your data in 2D/3D graphs and perform statistical analysis.
Graph Cartesians, polars, parametrics, slope fields, volumes of rotation.
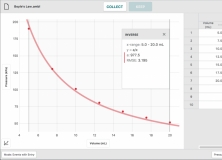
Collect, share, and analyze Vernier LabQuest sensor data.
ConvertLIT GUI is a graphical user interface for command-line tool ConvertLIT.
RJS Graph produces professional scientific and mathematical graphs.